Time Series and Trend Analysis Challenge Inspired by Real World Datasets
This is a review of Time Series and Trend Analysis Challenge Inspired by Real World Datasets by Nate Rositi (https://www.kdnuggets.com/time-series-and-trend-analysis-challenge-inspired-by-real-world-datasets). All the graphics are coming from the original article, too.
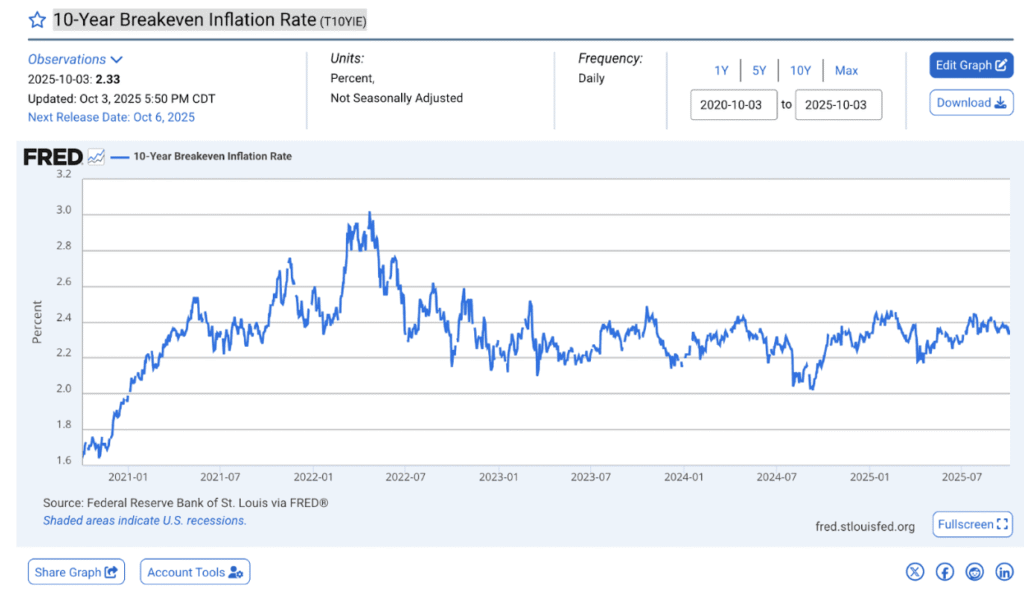
Time series data is everywhere: sales over time, website traffic, stock prices, sensor readings, inventory withdrawals — virtually any sequential business measurement can be modeled as a time series.
KDnuggets’ article on real-world time series challenges does not present a single algorithm, but rather exposes readers to the messiness and complexity inherent in real time series analysis. It emphasizes practical concerns that data scientists (and analytics teams) must confront when working with real business data.
In this overview, we distill the key themes, practical takeaways, and examples that make time series analysis something beyond textbook forecasting.
Real-World Time Series Are Noisy, Messy, and Multi-Dimensional
Unlike synthetic or idealized datasets, real world time series often suffer from:
- Irregular time steps (missing dates, uneven sampling)
- Structural breaks (sudden changes due to policy/market/environment)
- Seasonality multiplicity (multiple cycles at once — daily + weekly + annual)
- External drivers (promotions, holidays, weather events)
The article stresses that pre-analysis data inspection is a must — don’t assume your series is smooth, complete, or stationary.
Typical textbook assumptions like stationarity or white noise residuals are often violated in practice, necessitating:
- transformation
- feature engineering
- contextual augmentations
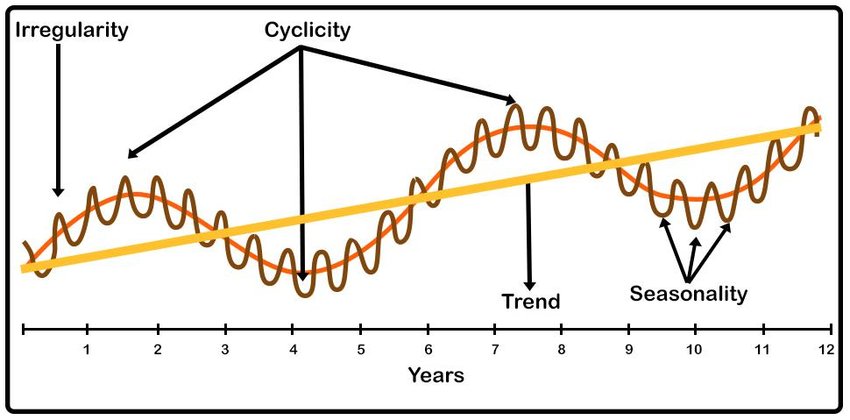
Trend and Seasonality Detection Are Key Building Blocks
A large part of real world time series work involves separating and understanding:
- Trend – long-term direction
- Seasonality – repeated cyclical patterns
The KDnuggets challenge illustrates that analysts should not just fit a seasonal model, but also interpret trend, which often requires blending domain knowledge with statistical tools.
Common approaches include:
• Decomposition
Methods like:
- STL (Seasonal and Trend decomposition using Loess)
- Classical decomposition
- Harmonic regression
…help isolate the signal from noise.
• Visual diagnostics
Line plots, lag plots, autocorrelation plots — all help assess:
- recurring patterns
- structural breaks
- change points.
Predictions Are Not Just About Forecast Accuracy
In real business use cases, the value of a time series model is often tied to decisions downstream:
- Inventory reorder points
- Sales planning
- Resource allocation
- Anomaly detection
Thus, measures such as MAE or RMSE (common forecasting metrics) are necessary but not sufficient. Business-centric evaluation might include:
- service level risk
- cost impact of forecast error
- buffer sizing
- scenario worst-case analysis
The article encourages analysts to think about impact, not just fit.
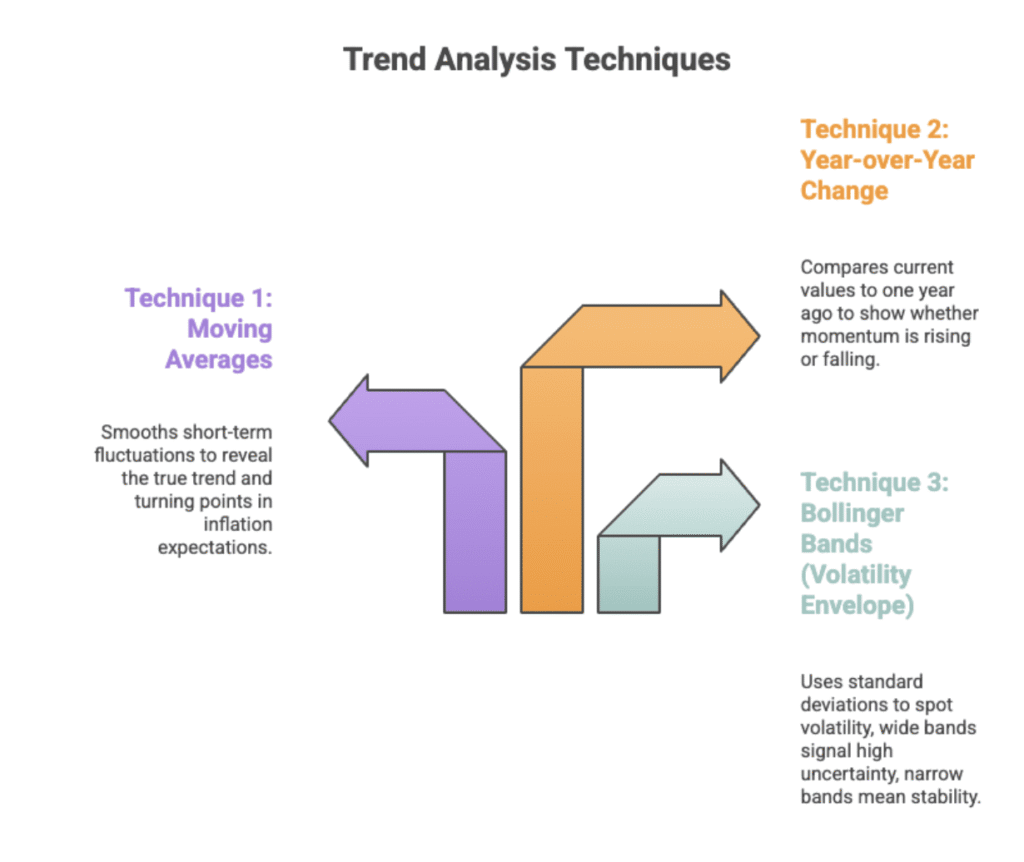
Feature Engineering Is a Major Driver of Performance
Real world time series problems rarely respond to black-box models alone. Instead, incremental performance gains typically come from thoughtful feature engineering:
- lag features
- rolling statistics (moving average, rolling variance)
- time indicators (day of week, month, holiday flags)
- external covariates (price, promotion, competition signals)
KDnuggets suggests that combining engineered features with models like:
- Gradient boosted trees (XGBoost, LightGBM)
- Random forests
- SARIMA / Prophet
…often outperforms naive or single-method forecasts.
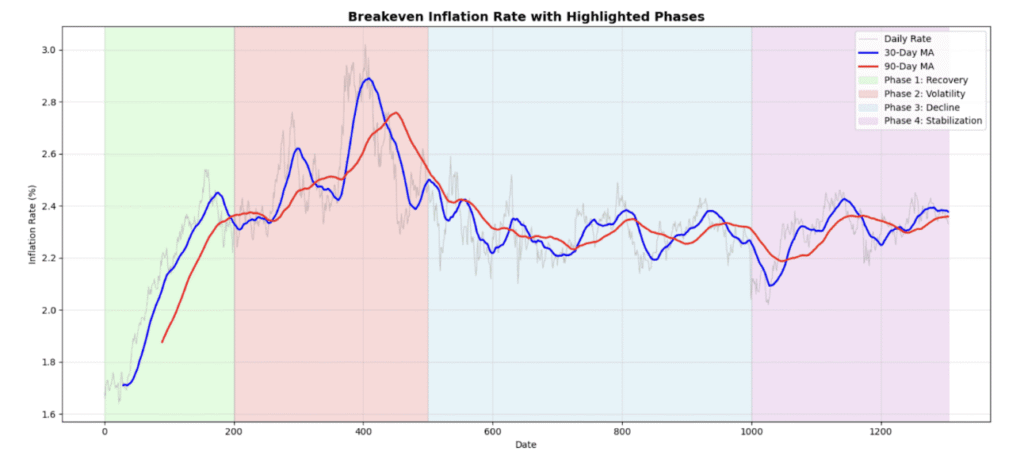
Change Points and Structural Breaks Matter
IThe article highlights that trends are not static. Many real world series have change points caused by:
- business strategy changes
- pricing changes
- supply/distribution shifts
- external shocks (pandemic, weather, macro events)
Detecting these points allows models to adjust appropriately, instead of forcing one trend across the entire history.
Tools commonly used include:
- Rolling segmentation
- Bayesian Change Point models
- ruptures (Python).
Business-Level Takeaways
Here are the lessons that matter most for a retail/operations audience:
✦ Don’t treat time series as a “plug-and-play” problem
Real data requires careful pre-processing and exploratory diagnostics.
✦ Trend and seasonality are separate — model them separately
Blend decomposition with forecasting.
✦ Feature engineering isn’t optional — it’s central
Predictors matter more as data complexity increases.
✦ Forecast accuracy is not the only success metric
Tie your evaluation to business KPIs (fill rates, service levels, inventory turns).
✦ Deployment readiness demands reproducible workflows