Case Study: Customer Churn
Executive Summary
Customer churn is one of the most expensive forms of revenue loss in subscription-based businesses. Even a small increase in churn can compound into significant annual revenue leakage, raising acquisition costs and reducing lifetime value.
The challenge facing the Telco operator in this case study was straightforward but critical:
- Identify customers at high risk of cancelling their subscription,
- Quantify the probability of churn at the individual level,
- Understand the key factors driving churn,
- Enable targeted retention actions that reduce voluntary cancellations.
While many organizations track churn retrospectively, this project focuses on predictive churn modelling, enabling proactive intervention rather than reactive analysis.
Business Problem
For subscription-based telco operators, churn is a silent profit killer. Acquiring a new customer is typically several times more expensive than keeping an existing one, yet many organizations still react to churn only after customers have already left. The goal of this project was to build a data-driven churn-prediction engine that identifies at-risk customers early enough to intervene with targeted retention actions, and to do so in a way that is transparent and intuitive for business users.
Concretely, we focused on three questions:
- Who is likely to churn in the coming months?
- Which factors drive this risk the most?
- How can we translate model outputs into clear, actionable customer segments and visual stories for decision makers?
Data & Methods
We worked with the well-known Telco Customer Churn dataset, which contains several thousand residential customers of a fictitious telecom provider. Each row represents one active subscription and combines:
- Customer attributes: tenure in months, contract type (month-to-month, one-year, two-year), payment method, paperless billing, etc.
- Service usage: phone and internet services, fiber vs DSL, optional add-ons such as online security, streaming TV and backup.
- Financial metrics: monthly charges and total lifetime charges paid by the customer.
- Outcome label: a binary churn flag indicating whether the customer has left the service.
This structure closely mirrors what many real-world telcos have in their CRM and billing systems, making the approach directly transferable.
Analytical approach
The end-to-end pipeline has four main stages:
- Data cleaning and feature engineering
We convert numeric fields such as TotalCharges to proper numerical types, impute missing values, and construct a binary churn target (Churn_Flag). Non-informative identifiers (e.g. customerID) are removed from the feature set. - Preprocessing and encoding
Numerical features (tenure, charges, etc.) are passed through unchanged, while categorical variables (contract type, internet service, payment method and so on) are one-hot encoded using a ColumnTransformer. This yields a clean, fully numeric feature matrix suitable for machine learning. - Model training and evaluation
We train a Random Forest classifier on a stratified train/test split. The model is configured to handle class imbalance (class_weight=”balanced”) and to capture non-linear interactions between services, pricing and contract conditions.
Performance is evaluated using:- ROC curve and AUC – showing how well the model separates churners from non-churners across all probability thresholds.
- Confusion matrix and classification report – giving a more operational view of correctly captured churners vs false alarms.
- Post-modeling analytics for business users
Raw probabilities are transformed into:- Feature importance rankings (global drivers of churn)
- Risk segments (low / medium / high churn risk buckets)
- Tenure-based “risk tunnel” visualization to tell the story of churn over the customer lifecycle.
All steps are automated in Python, so the pipeline can be re-run on updated data with minimal effort.
Results / Charts
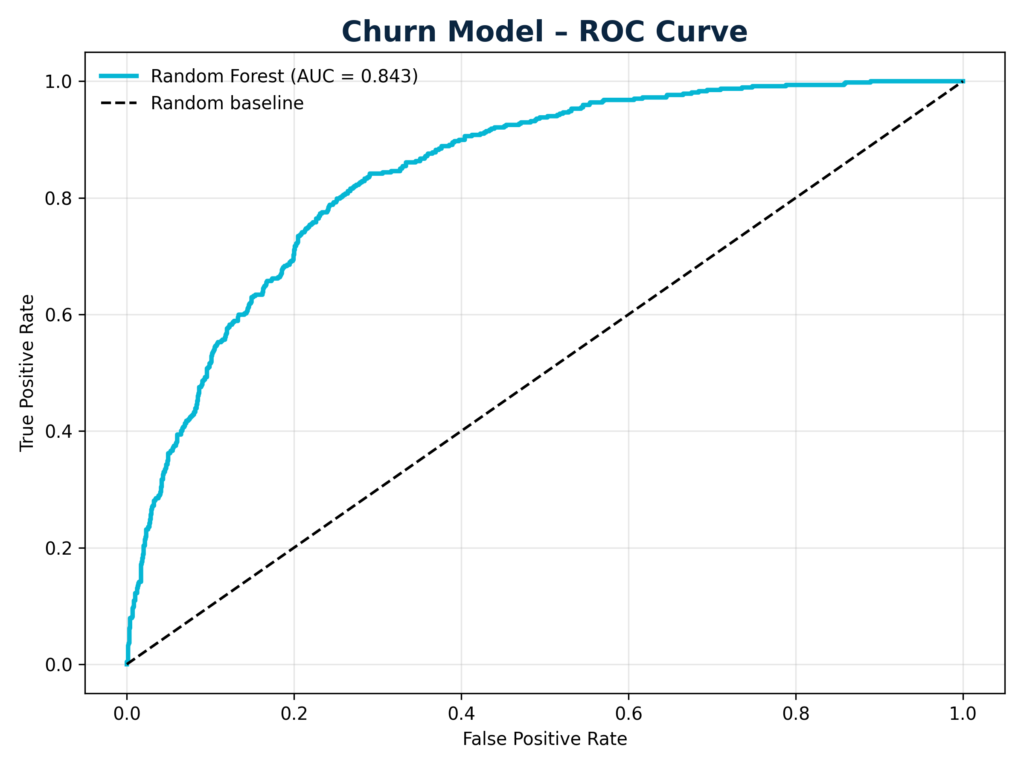
ROC curve
The ROC chart shows that the Random Forest model delivers strong discrimination: the curve lies well above the 45-degree random baseline. In practice this means the model can prioritize customers by churn risk much better than chance, which is exactly what retention teams need when budget is limited.
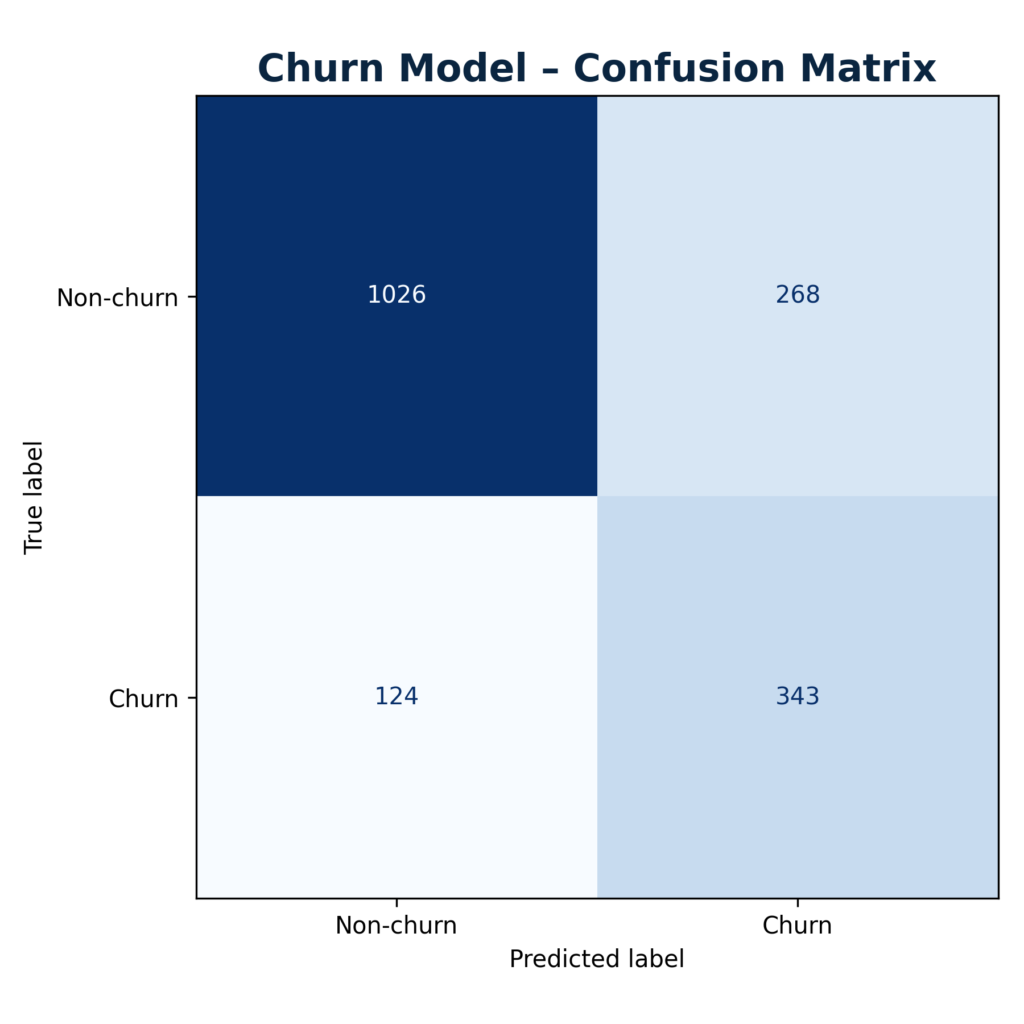
Confusion matrix
At a default 0.5 probability threshold the confusion matrix summarizes how many churners are correctly identified vs. missed, and how many loyal customers are incorrectly flagged as high risk. Business teams can tune this threshold depending on whether they prefer to maximize recall of potential churners or keep the number of unnecessary retention offers low.
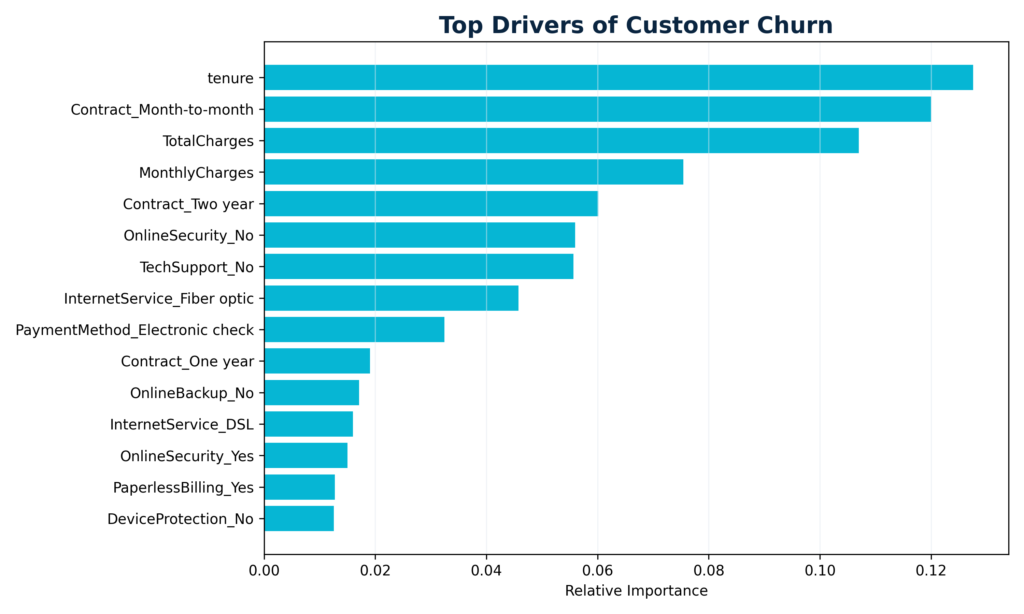
Top drivers of churn (feature importance)
The feature-importance bar chart reveals the most influential variables behind the model’s predictions. Typical patterns include:
- Short tenure and month-to-month contracts increasing churn risk..
- Higher monthly charges, especially in combination with optional add-ons, pushing customers towards leaving.
- Certain internet service types and payment methods being associated with higher attrition.
This ranking helps to validate business intuition and highlight where contractual or pricing redesign might have the largest impact.
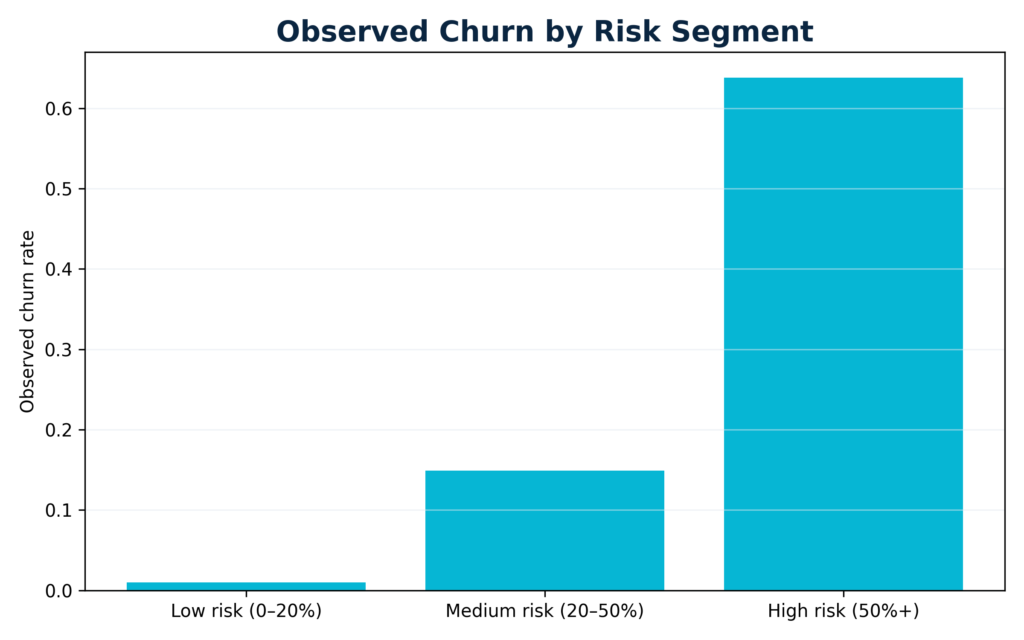
Risk segments and observed churn rate
Each customer receives a predicted churn probability. We then group customers into three intuitive segments:
- Low risk (0–20%).
- Medium risk (20–50%)
- High risk (50%+)
The corresponding bar chart shows the observed churn rate in each bucket. As expected, churn incidence rises sharply from the low-risk to the high-risk segment, confirming that the probabilities are well-calibrated. This segmentation allows marketing teams to attach different retention playbooks and budgets to each group, from light-touch engagement up to proactive save-offers.
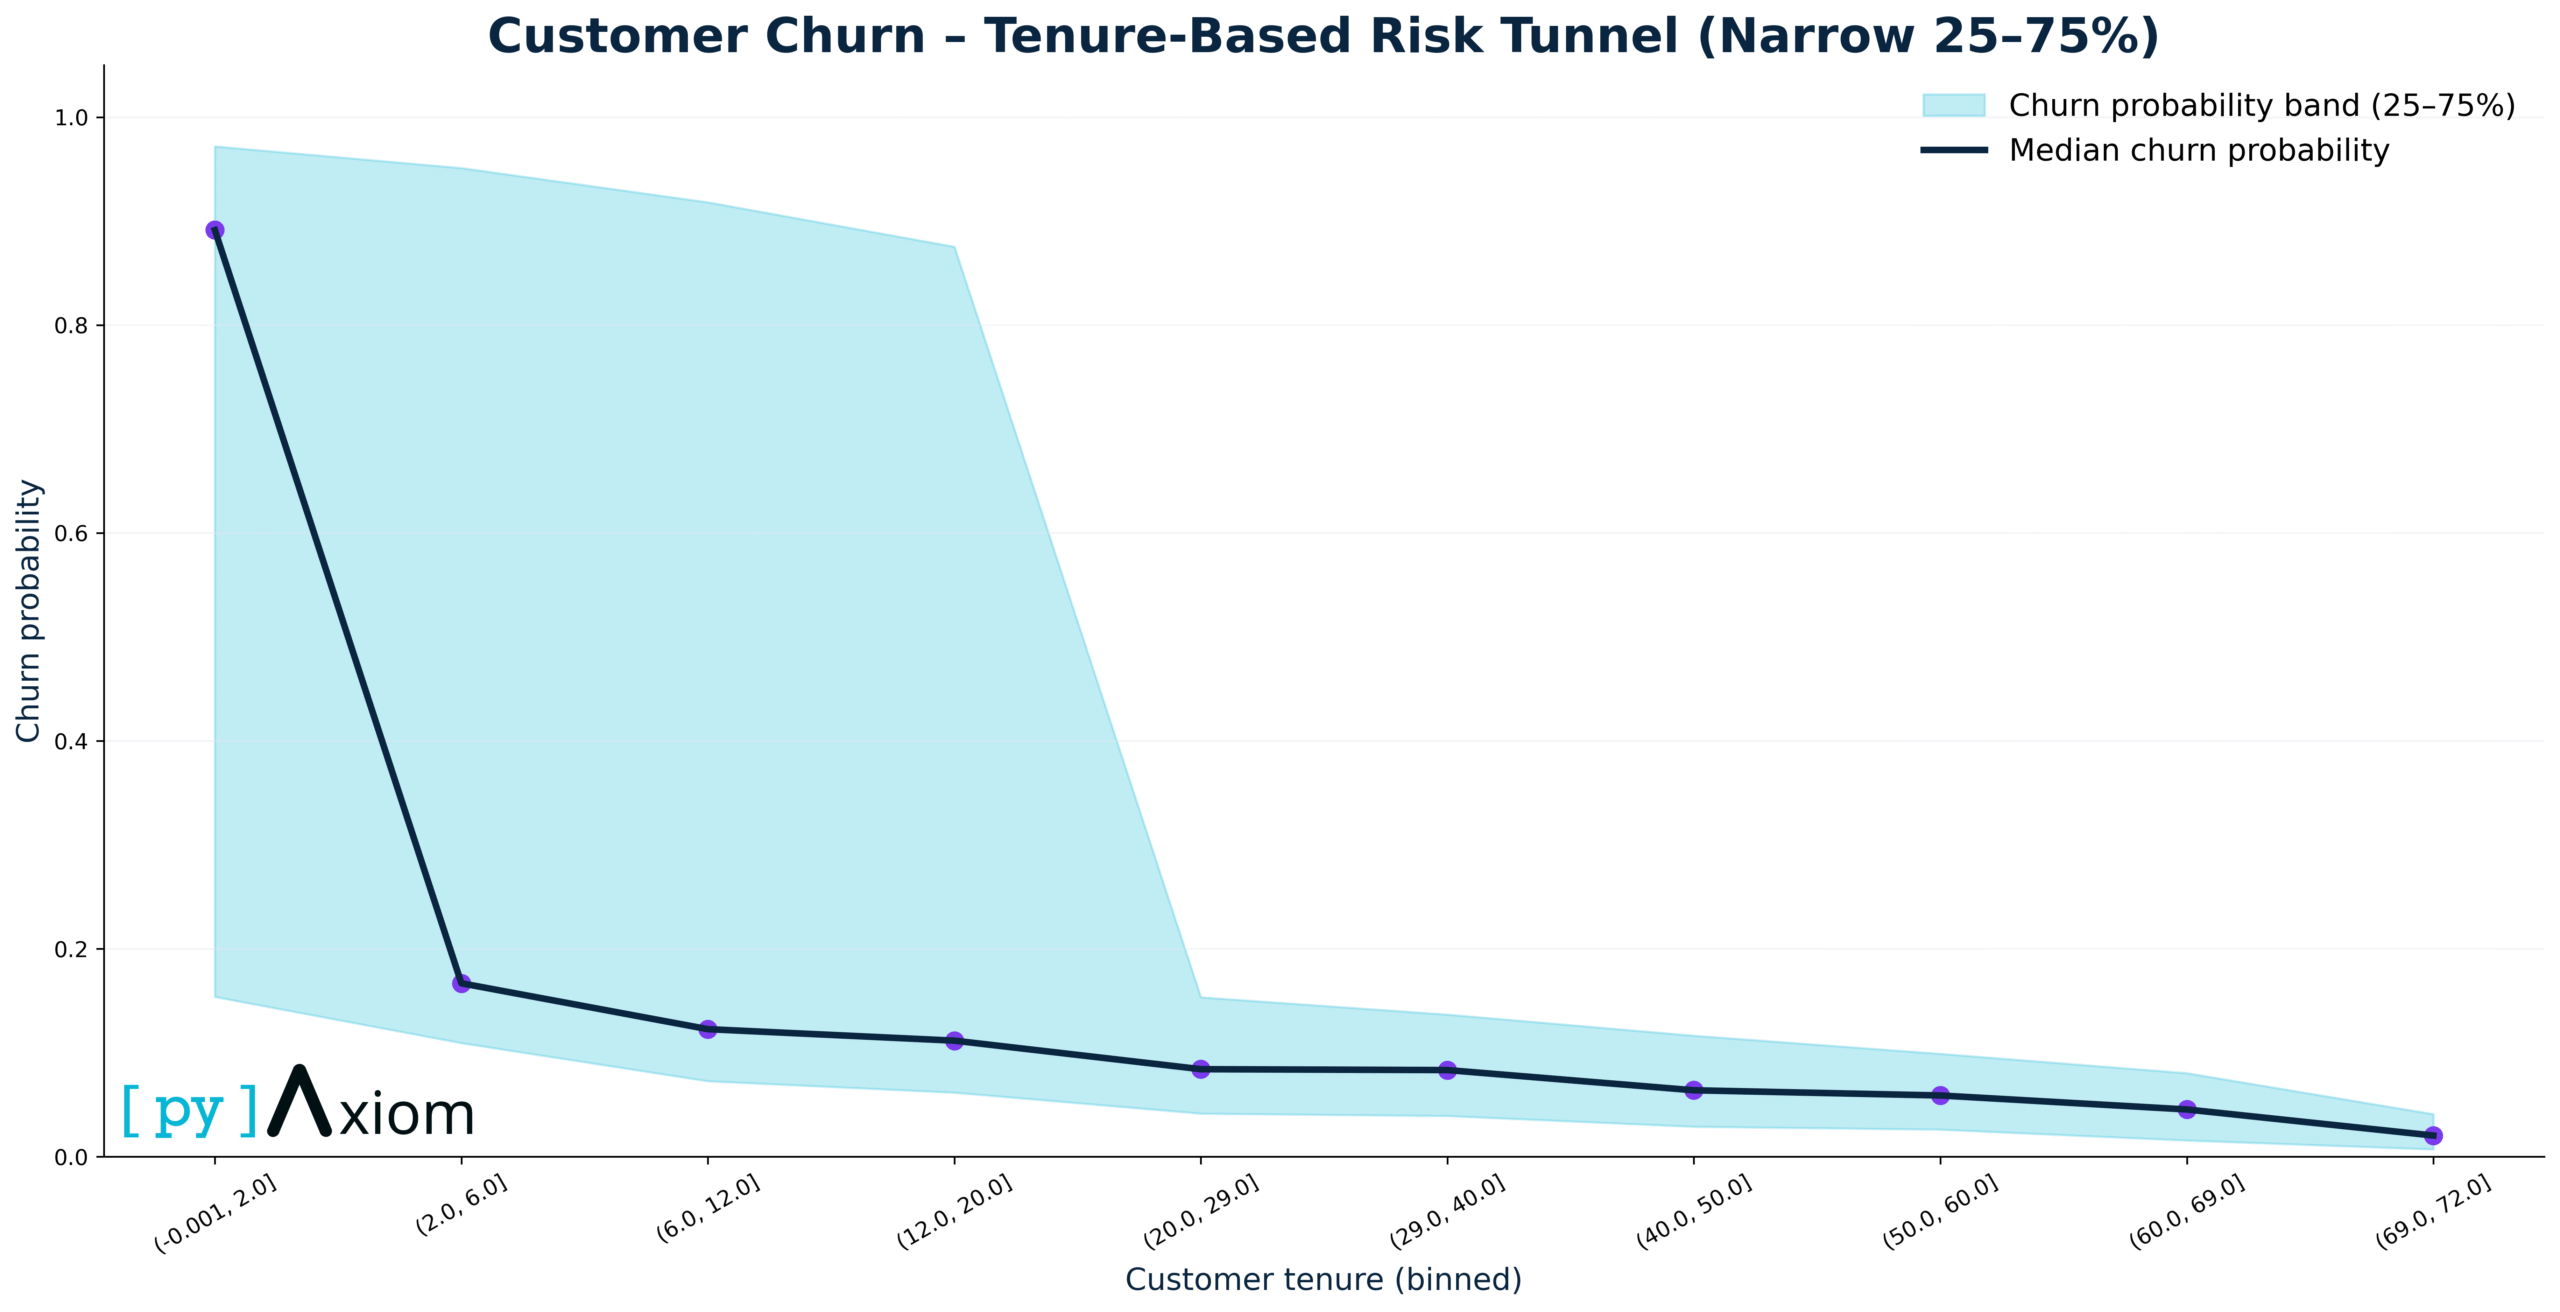
Tenure-based “risk tunnel”
For the homepage hero section, we introduce a more visual story: the Tenure-Based Risk Tunnel. Here we:
- Bin customers by tenure in months (e.g. 0–3, 3–6, … up to 72+)
- Compute, for each bin, the average predicted churn probability and the spread around it (mean ± one standard deviation).
- Plot the average as a smooth line and the uncertainty band as a shaded “tunnel”.
The resulting chart shows a clear pattern
- Churn peaks in the very early months of the relationship, when customers are still evaluating the service and comparing alternatives.
- As tenure increases, the average churn probability declines steadily, and the band gradually narrows – long-standing customers are both more loyal and more homogeneous in their behavior.
- The light-blue tunnel band highlights that, even within the same tenure group, some customers are far riskier than others, underscoring the value of individualized prediction instead of simple tenure-based rules.

Business Impact
Taken together, these results provide a full story for commercial and retention teams:
- The model is accurate enough to distinguish low- from high-risk customers, as shown by the ROC curve and the sharp gradient in churn rates across risk buckets.
- We can clearly explain why customers are at risk: short tenure, flexible contracts and higher charges emerge as key drivers, supported by other service and payment factors.
- The risk segments translate abstract probabilities into operational groups that can be targeted with differentiated offers, call-center scripts or digital journeys.
- The tenure-based risk tunnel delivers a simple but powerful message: invest heavily in the first months of the relationship, because that is where churn risk – and therefore the upside of good onboarding and service design – is highest.
The same pipeline can be re-trained on fresh data or adapted to other subscription businesses (media, utilities, SaaS), giving organizations a repeatable way to monitor churn risk and design smarter, data-driven retention strategies.