
Applied Analytics
Forecasting, anomaly detection, and decision-support models
built on real business data

Open Data & Public Analytics
Urban data, open datasets, and reproducible analysis using
modern statistical tooling

Methods & Models
From classical statistics to machine learning —
explained with practical examples

Reproducible Code
Python and R implementations designed for clarity,
reuse, and auditability
Featured Insight

NYC Open Data: From Raw Datasets to Actionable Insights
A practical introduction to NYC Open Data and the nycOpenData R package,
with a focus on reproducible analytics and public-sector use cases.
Interested in the data, models, or implementation details?
If a particular insight caught your attention and you’d like to explore the underlying data, analytical approach, or reusable code, feel free to get in touch.
I’m happy to share details or discuss how this could apply to your context.
More readings
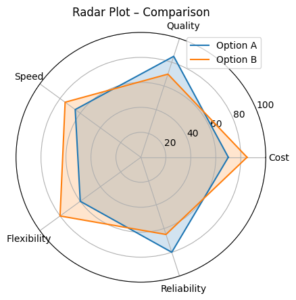
Radar Plot
What is a Radar Plot (Spider Chart)? A radar plot (also called spider chart or…
Stochastic Inventory Management for Retail
Inventory Management for Retail Under Stochastic Demand – Key Takeaways This is a review of…
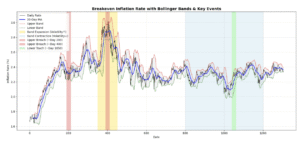
Time Series and Trend Analysis Challenge Inspired by Real World Datasets
Time Series and Trend Analysis Challenge Inspired by Real World Datasets This is a review…
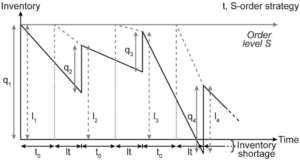
Wagner–Whitin Revisited: Optimal Inventory Planning Without Guesswork
Wagner–Whitin Revisited: Optimal Inventory Planning Without Guesswork Reducing inventory without hurting service levels is one…
NYC Open Data Made Practical: An Analyst’s Guide with R
Unlocking Civic Insights with NYC Open Data and the nycOpenData R Package New York City…