Case Study: Anomaly Detection in Finance Environment
Executive Summary
Financial institutions process thousands of credit applications and payment transactions every day.
The goal of this case study is to show how a modern machine learning pipeline can help a lender detect high-risk customers early and prioritise manual review capacity.
The main findings:
- Risk concentration was identified and visualised.
- Cases for potential interventionwere precisely determined.
- Segmentation enables a more refined credit policy.
Business Problem
Financial institutions process thousands of credit applications and payment transactions every day. A small fraction of these cases turn into losses: customers default on their obligations or commit fraud.
The challenge is that these anomalies are rare (≈8%), but they are responsible for a disproportionate share of the total risk.
The goal of this case study is to show how a modern machine learning pipeline can help a lender detect high-risk customers early and prioritise manual review capacity, while keeping the experience smooth for the majority of low-risk applicants.
Data & Methods
For this demonstration we use a public Kaggle credit dataset exported into anomaly.csv. Each row represents a customer, with a binary target:
- TARGET = 1 – customer behaves abnormally (default / high-risk outcome),
- TARGET = 0 – normal repayment behaviour
In our sample of 86,172 customers, about 8.1% have TARGET = 1, which is a realistic level of class imbalance.
The input features combine demographic and financial information, for example:
- Demographics: gender (CODE_GENDER), family status (NAME_FAMILY_STATUS), income type (NAME_INCOME_TYPE), occupation (OCCUPATION_TYPE).
- Assets & liabilities: total income, loan amount and annuity (AMT_INCOME_TOTAL, AMT_CREDIT, AMT_ANNUITY, AMT_GOODS_PRICE),
- ~20 engineered features,
From these raw variables we engineer a few business-friendly features, such as age in years and years in employment, to make the model easier to interpret.
Modeling & Risk Segmentation
The analysis starts with exploratory data analysis. We compute the anomaly rate across several categories::
- by income type (e.g. working, commercial associate, pensioner)
- by family status (single, married, divorced, etc.)
This immediately reveals that certain segments have materially higher anomaly rates, which already supports better policy design and credit rules.
For the predictive layer we train a Random Forest classifier on a stratified train-test split. Categorical variables are encoded with one-hot encoding; numerical features are fed directly into the model. Because anomalies are rare, we use class-weighted training so that the model pays more attention to the minority class.
Model performance is evaluated on the hold-out test set using:
- the ROC curve and AUC (area under the curve)
- a confusion matrix at a slightly lower probability threshold (0.35 instead of 0.5), which is more appropriate when the cost of missing a risky case is high
The resulting ROC curve shows a strong separation between normal and anomalous customers, with an AUC comfortably above random guessing. The confusion matrix highlights the trade-off between detecting a high share of anomalies and keeping the false-positive load manageable for operations.
After training we score all customers and compute a predicted anomaly probability for each. These probabilities are then translated into:
- three intuitive risk segments – low, medium and high risk
- ten probability deciles – for a more granular view of risk concentration
This risk segmentation is what ultimately enables the business to prioritise investigations, adjust pricing, or tighten underwriting rules in a targeted way.
Results / Charts
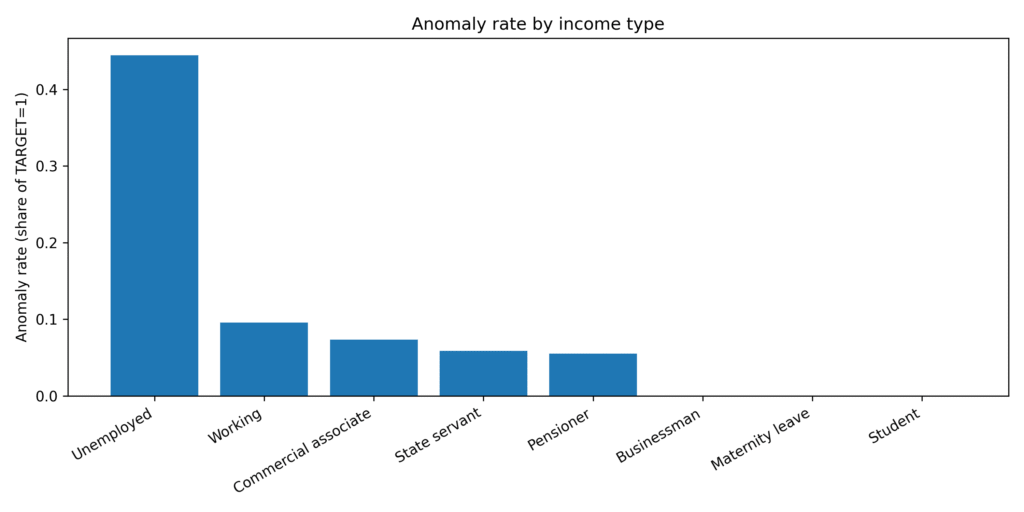
Anomaly rate by income type
This bar chart highlights how the overall fraud rate differs across income categories.
Clear hierarchy
- Unemployed customers have by far the highest anomaly rate — exceeding 45%.
- Working, Commercial associates, State servants, and Pensioners cluster in a mid-range band of roughly 5–10%.
- Businessmen, Students, and those on Maternity leave show very low fraud incidence.
Bottom line
Employment status alone is a powerful predictor: unemployment represents an outsized risk factor in the dataset.
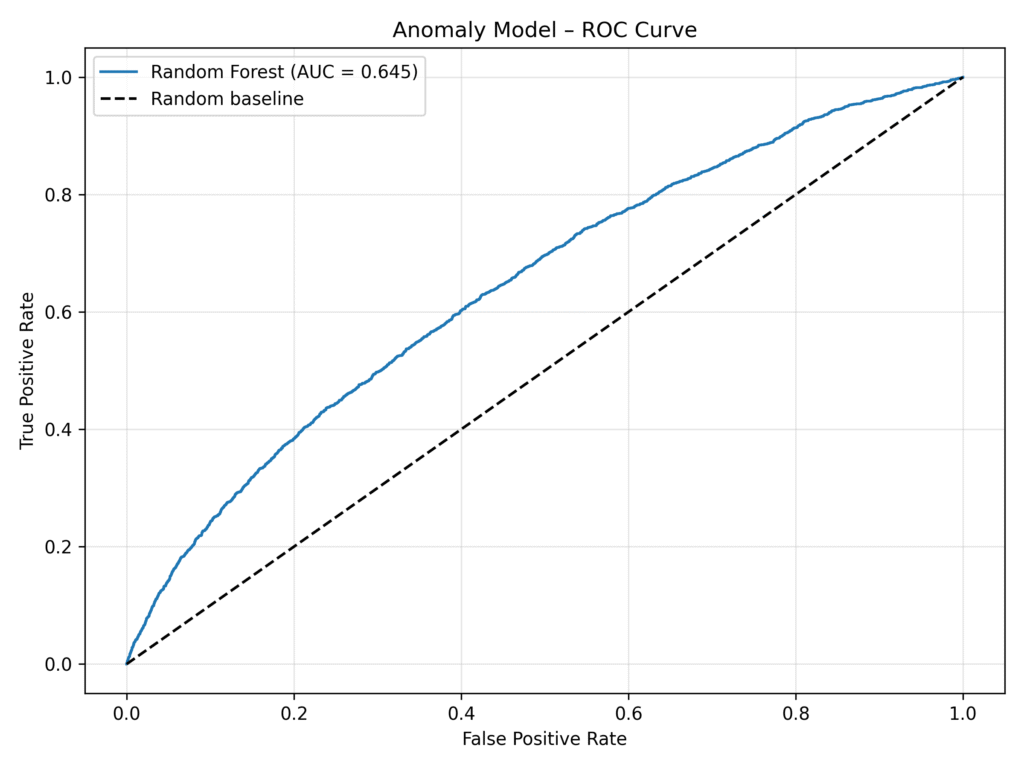
Model performance: ROC curve
The ROC curve assesses how well the Random Forest anomaly model separates fraud from non-fraud cases.
Reading the curve
- The blue line consistently rises above the diagonal random baseline.
- However, the curve is not steep enough to deliver high true-positive rates without increasing false positives.
What this means operationally
There is clear predictive signal present, but further feature engineering, balancing, or model tuning could meaningfully improve discrimination power.
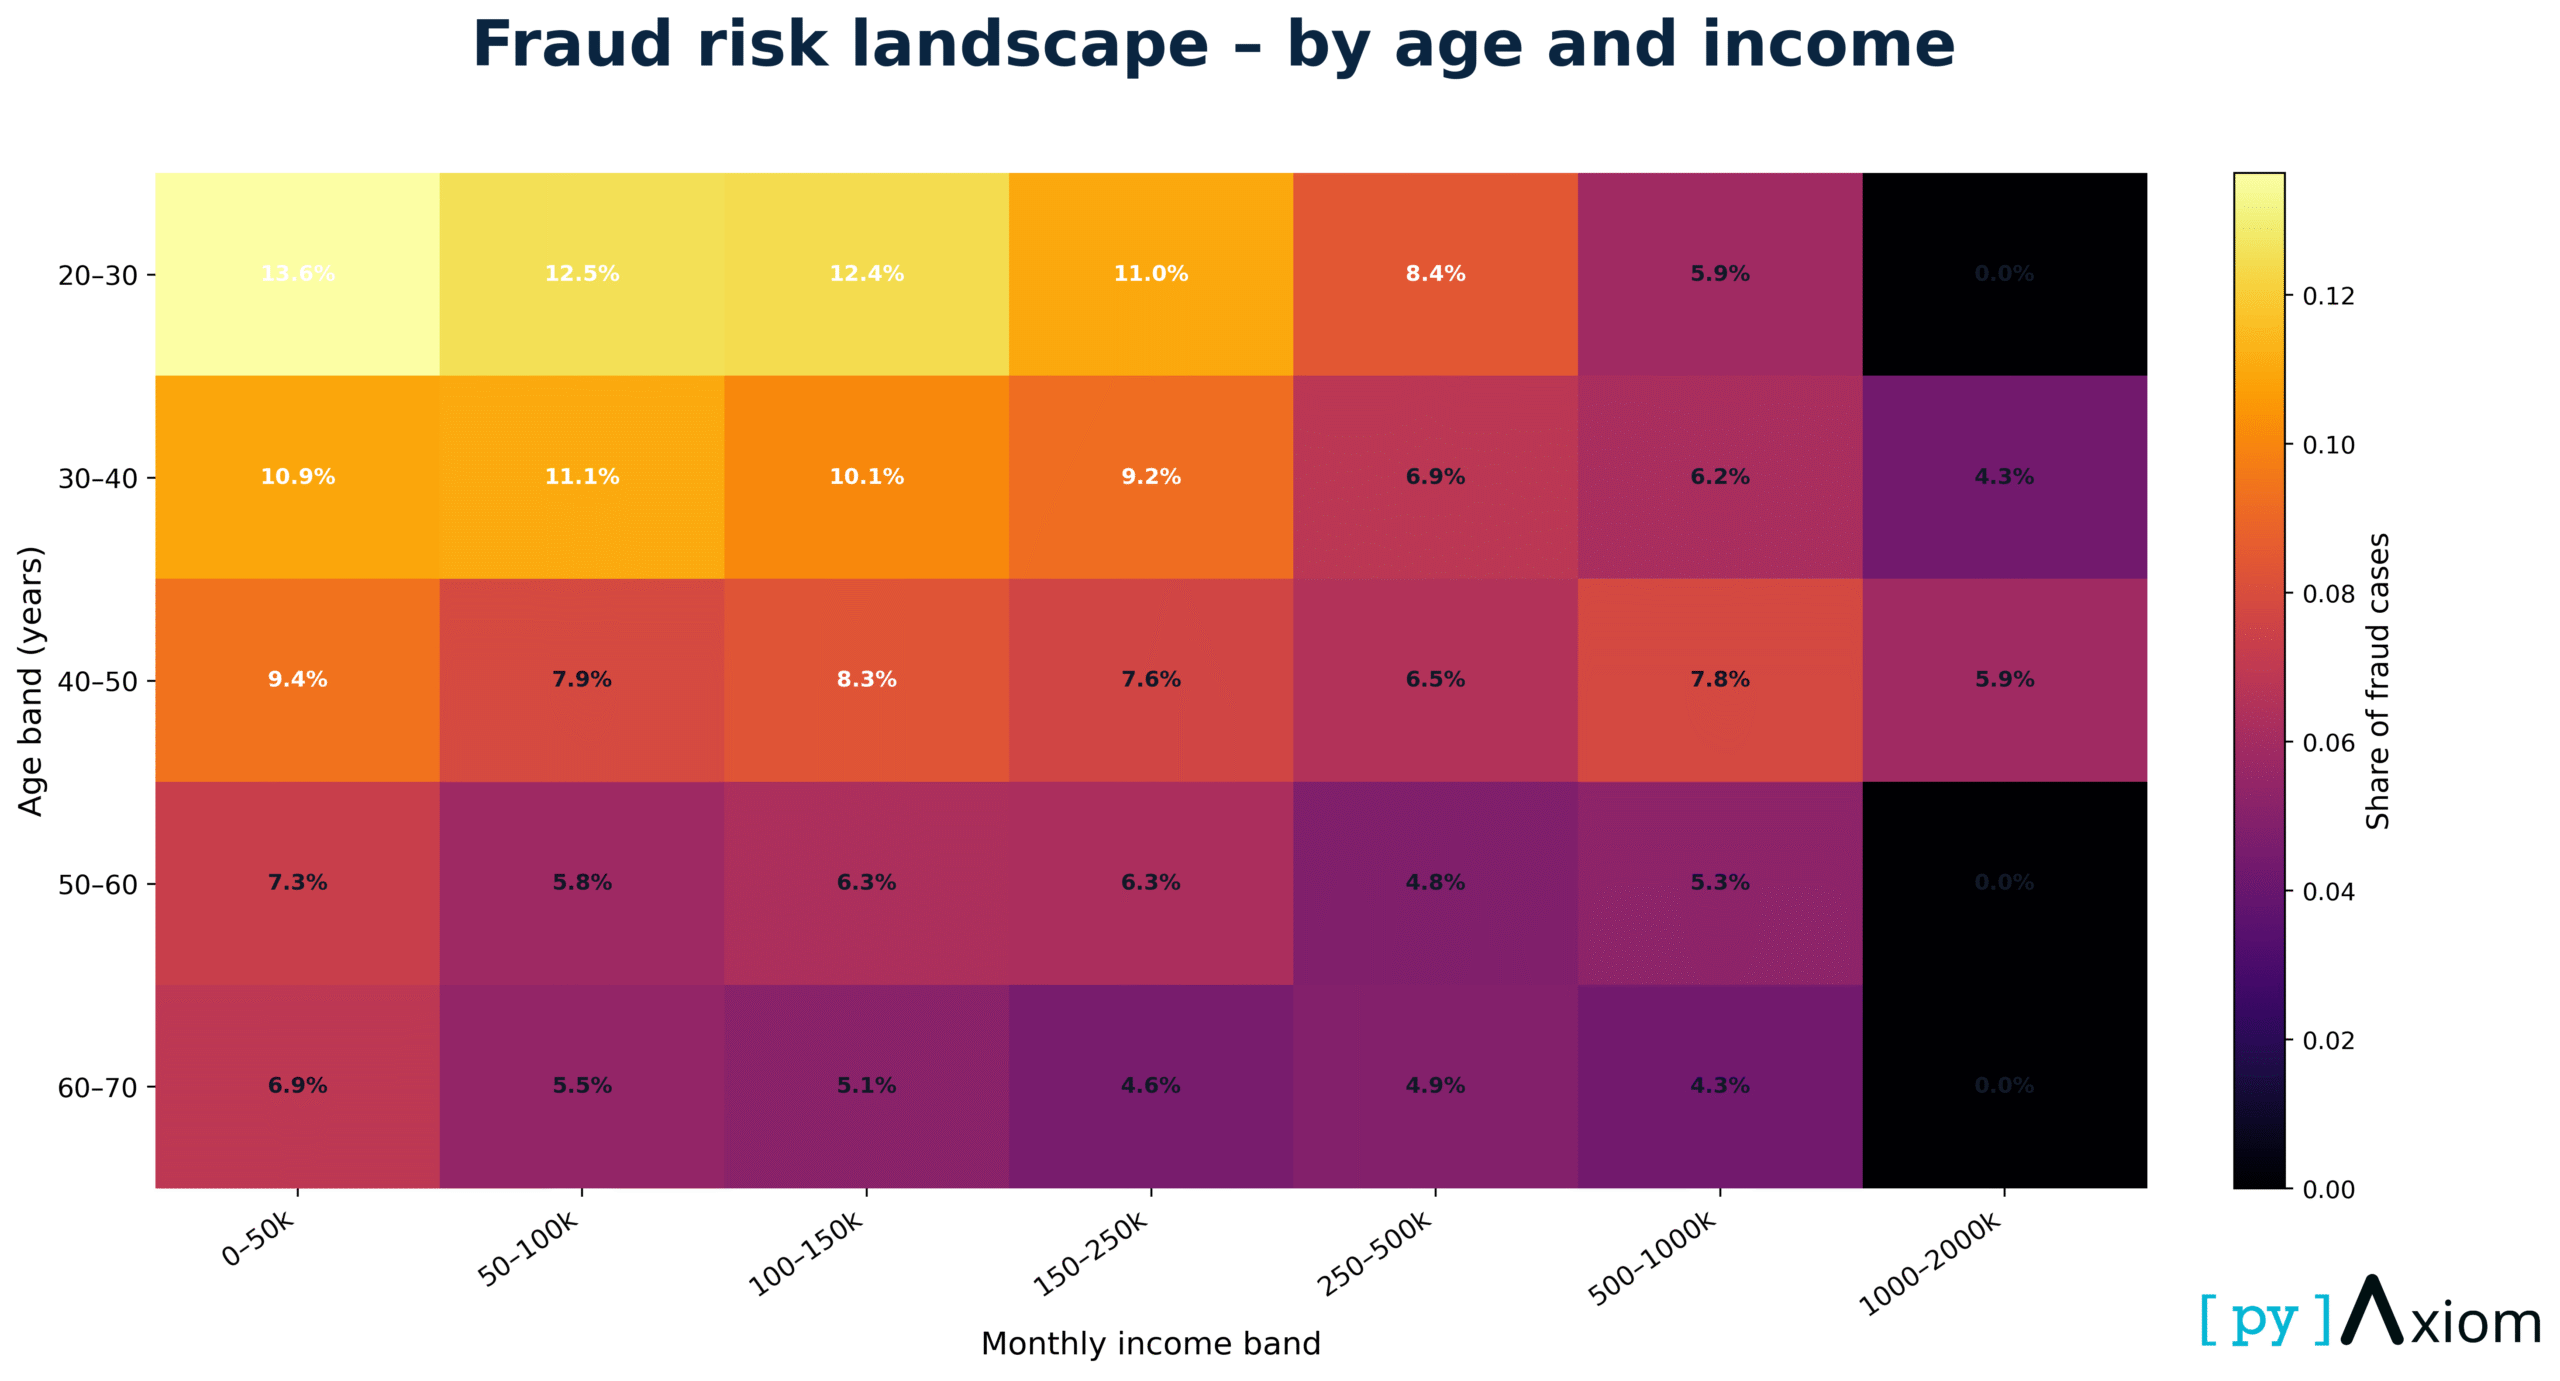
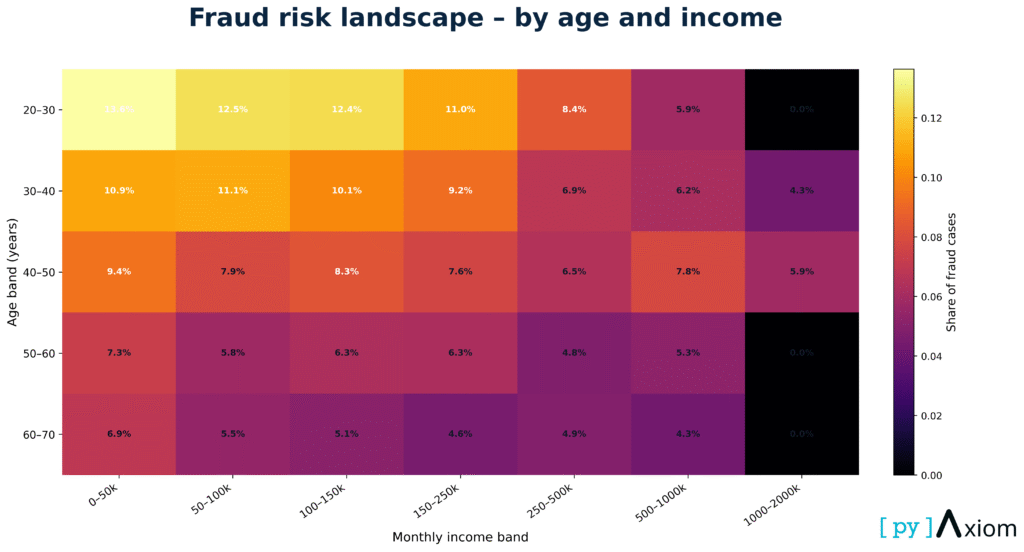
Fraud landscape across age and income bands
This heatmap maps fraud share across the joint space of age group and monthly income band — one of the most revealing combinations in the dataset.
- Fraud risk is highest among 20–30 year-olds with low incomes (0–50k) — above 13%.
- Fraud rates consistently decline with age, across nearly all income brackets.
- The highest income groups (500k–2M) show almost zero fraud, regardless of age.
Fraud concentrates where financial pressure is highest and economic stability is lowest.
Age + income is one of the strongest two-dimensional drivers of anomaly probability.

Credit amounts cluster differences
This ridgeline chart shows how credit amounts (on a log10 scale) distribute across the main income categories.
It helps reveal which groups tend to take smaller, more homogeneous loans, and which ones show a broader, higher-value range.
- State servants display a concentrated mid-range pattern with very few extreme values.
- Pensioners have one of the tightest distributions, dominated by modest credit amounts.
- Commercial associates show a noticeably wider spread, including higher credit bands.
- Working individuals also exhibit variation, but not as wide as commercial associates.
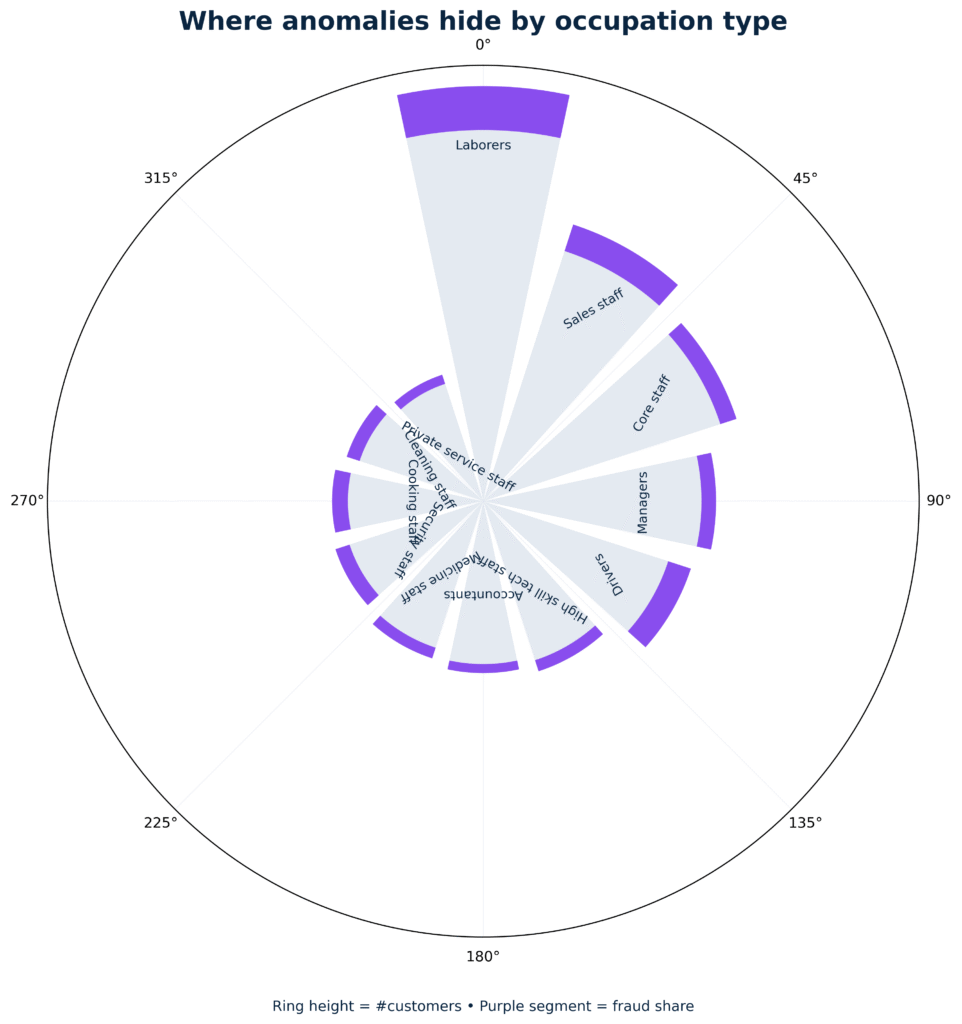
Occupation categories: where anomalies really cluster
This circular bar chart visualizes, for each occupation type, both the number of customers (bar length) and the fraud share (purple top segment).
- Laborers combine both high volume and high fraud share — the strongest risk signal in the dataset.
- Sales staff and Core staff show moderate fraud ratios paired with sizeable customer bases.
- High-skill, academic, and specialized staff tend to have much lower fraud shares, though sample sizes are also smaller.
- Managers and Drivers display elevated but not extreme anomaly levels.
Business Impact
The analytical results above highlight how data-driven fraud detection can translate directly into better portfolio quality, stronger credit policies, and more efficient operational processes. The feature importance ranking from the Random Forest model already provides a concise view of the key behavioural drivers behind anomalies: relative indebtedness (e.g., higher loan amounts or instalments relative to income), customer profile markers such as income type and occupation, and lifecycle factors like age and employment stability. These variables consistently appear at the top of the model’s importance list and form a practical checklist for credit policy teams when refining eligibility criteria.
The broader exploratory analysis deepens this picture. Credit amount distributions differ visibly across income types, indicating that certain customer groups naturally operate in narrower or broader risk bands. Occupation categories reveal clear concentrations of anomalies, particularly among physical-labour roles with high sample sizes and elevated fraud shares. Age–income heatmaps provide an even sharper lens: young, low-income customers generate the highest fraud rates, while older, higher-income segments show near-zero risk. Finally, segmentation by income type confirms that unemployment is a disproportionately strong risk factor, with anomaly rates several times higher than any other category.
These insights matter because they make risk visible in a structured, evidence-based way. When the observed anomaly rate climbs sharply from low-risk to high-risk buckets—sometimes two to four times the portfolio average—it provides a clear rationale for differentiated treatment. High-risk segments can be routed to enhanced verification, stricter credit limits, or alternative product structures, while low-risk groups can be served faster and with fewer friction points.
From a business standpoint, this is the essence of BI-supported fraud and risk management:
- More precise decisions — informed by actual behavioural patterns rather than broad assumptions.
- Reduced losses — by pre-emptively identifying where problems will most likely emerge.
- Operational efficiency — as manual review teams focus their effort exactly where it adds most value.
- Better customer experience — through streamlined processing for low-risk customers.
In practice, even moderate-performing models (like the ROC curve with an AUC of 0.645) can deliver meaningful improvements when combined with targeted segmentation and clear business rules. The combination of statistical modelling and intuitive visual diagnostics gives risk teams a balanced toolkit: robust enough for analytics, but transparent enough for decision makers.
This creates a measurable, sustainable uplift in portfolio stability while reinforcing a more intelligent, data-driven lending strategy.